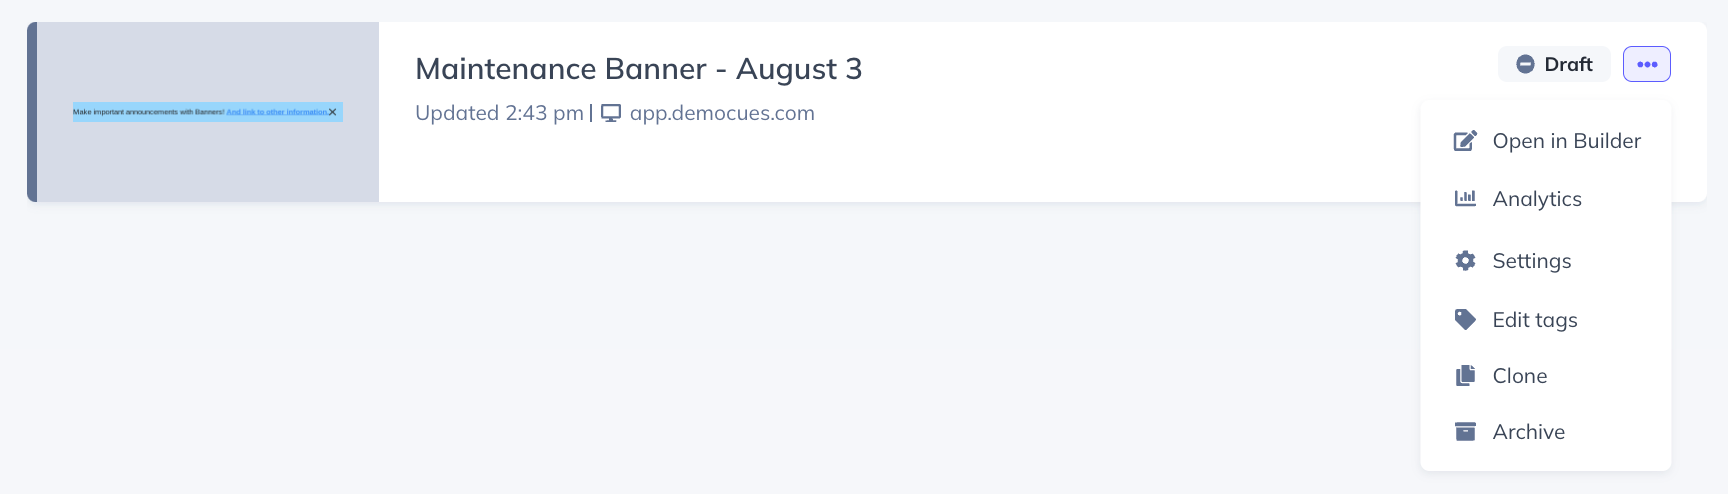
Analytics for your Banner experiences are here! 🙌 You can now see who interacted with your Banners just like you already do with Flows. 👀 (Click the three dots on the right of the Banner you're interested in taking a look).
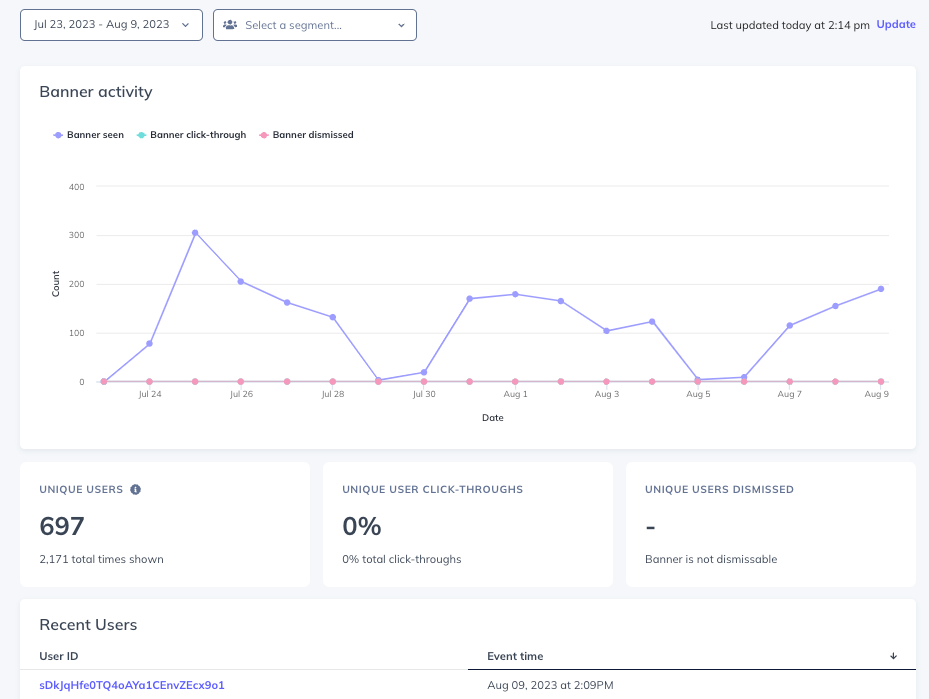
The analytics page contains key metrics, including:
- A 'Banner activity' chart and matching numerical section with counts for Banner Seen, Banner Click-Through, and Banner Dismissed
- A 'Recent Users' section with a list of those users shown a Banner
That's not all! You can now also understand how your Banners are performing over time from within the Events Explorer. To do so:
- Choose 'Banner Events' from the dropdown menu
- Choose a Banner
- Visulize how often your Banner has been seen, interacted with, or dismissed over time
- Adjust the date filter to see more than the past 7 days (if need be)
- Create a Saved Chart with any metrics you'd like to revisit regularly